

Power over Fiber for Temperature and Current Monitoring on High-Voltage Lines
Bring the sensors close to the conductor while keeping power and data electrically isolated. Monitoring temperature and current on high-voltage lines requires more than accurate sensing: the electronics at conductor potential also need a dependable power source. Power over Fiber (PoF) delivers laser light through an optical fiber and converts it into electricity at the remote node to operate sensors, acquisition electronics and communications.
This application design case draws on published research. The original diagrams illustrate a proposed architecture, not a completed installation or field-validated product performance.
The application: interpret temperature in the context of load
Temperatures at conductors, joints and clamps need to be assessed alongside load current and environmental conditions. A temperature reading alone may not distinguish ordinary load-related heating from a developing connection problem. Current alone does not reveal the thermal condition of a particular joint. This design therefore proposes collecting both measurements at critical locations, together with timestamps, supply status and communication quality.
Candidate sites include substation line exits, test facilities and selected overhead-line monitoring points with a suitable insulated fiber route. Suitability for any voltage class depends on the installation and its insulation verification. For widely distributed points, fiber installation cost and maintenance access should also be compared with alternative power arrangements.
The architecture: optical power out, optical data back
A laser source, driver and data receiver sit at ground potential. Power travels through a dedicated fiber to a photovoltaic converter at high potential. Regulated electrical output then supplies the acquisition and communication electronics. A separate fiber returns the measurements. Keeping power and data paths separate makes their loss budgets, interfaces and fault diagnosis easier to assess independently.
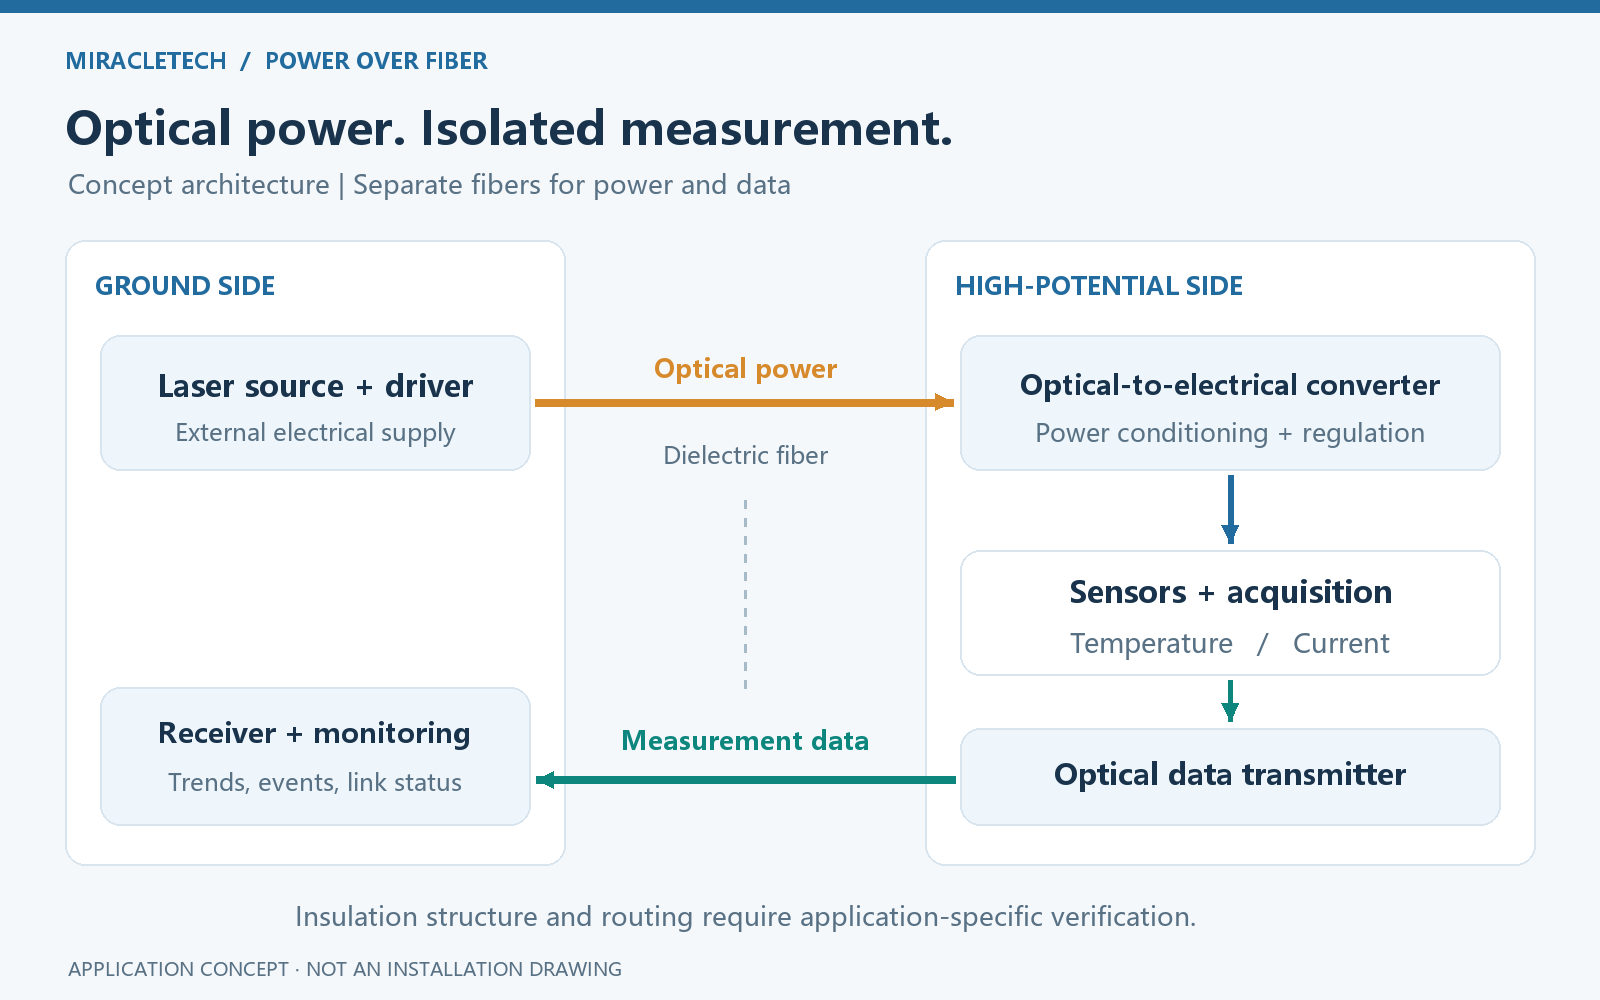
Published work on a medium-voltage distribution-network instrument demonstrates PoF powering electronics for current, voltage and temperature acquisition. It provides evidence for the approach, but its prototype results do not establish the rating of a different high-voltage installation.
All-dielectric fiber avoids a metallic conducting path in the power link. Cable construction, connectors, supports and creepage paths still require system-level insulation design. The fiber's resistance to electromagnetic interference does not make the sensor electronics immune to their surroundings.
The measurements: temperature, current and node health
Temperature. A contact platinum resistance sensor or thermistor can measure conductor or joint surface temperature. The design must account for attachment, contact pressure, sunlight and airflow. Circuit-board temperature is useful for compensation and diagnostics, but is not a substitute for conductor surface temperature.
Current. For AC lines, a Rogowski coil with suitable integration and acquisition circuitry is one option. Selection must consider range, frequency response and phase error. A Rogowski coil does not measure the DC component. DC applications require a DC-capable sensor, such as an appropriate Hall-effect or fluxgate device, and a revised power budget and calibration plan.
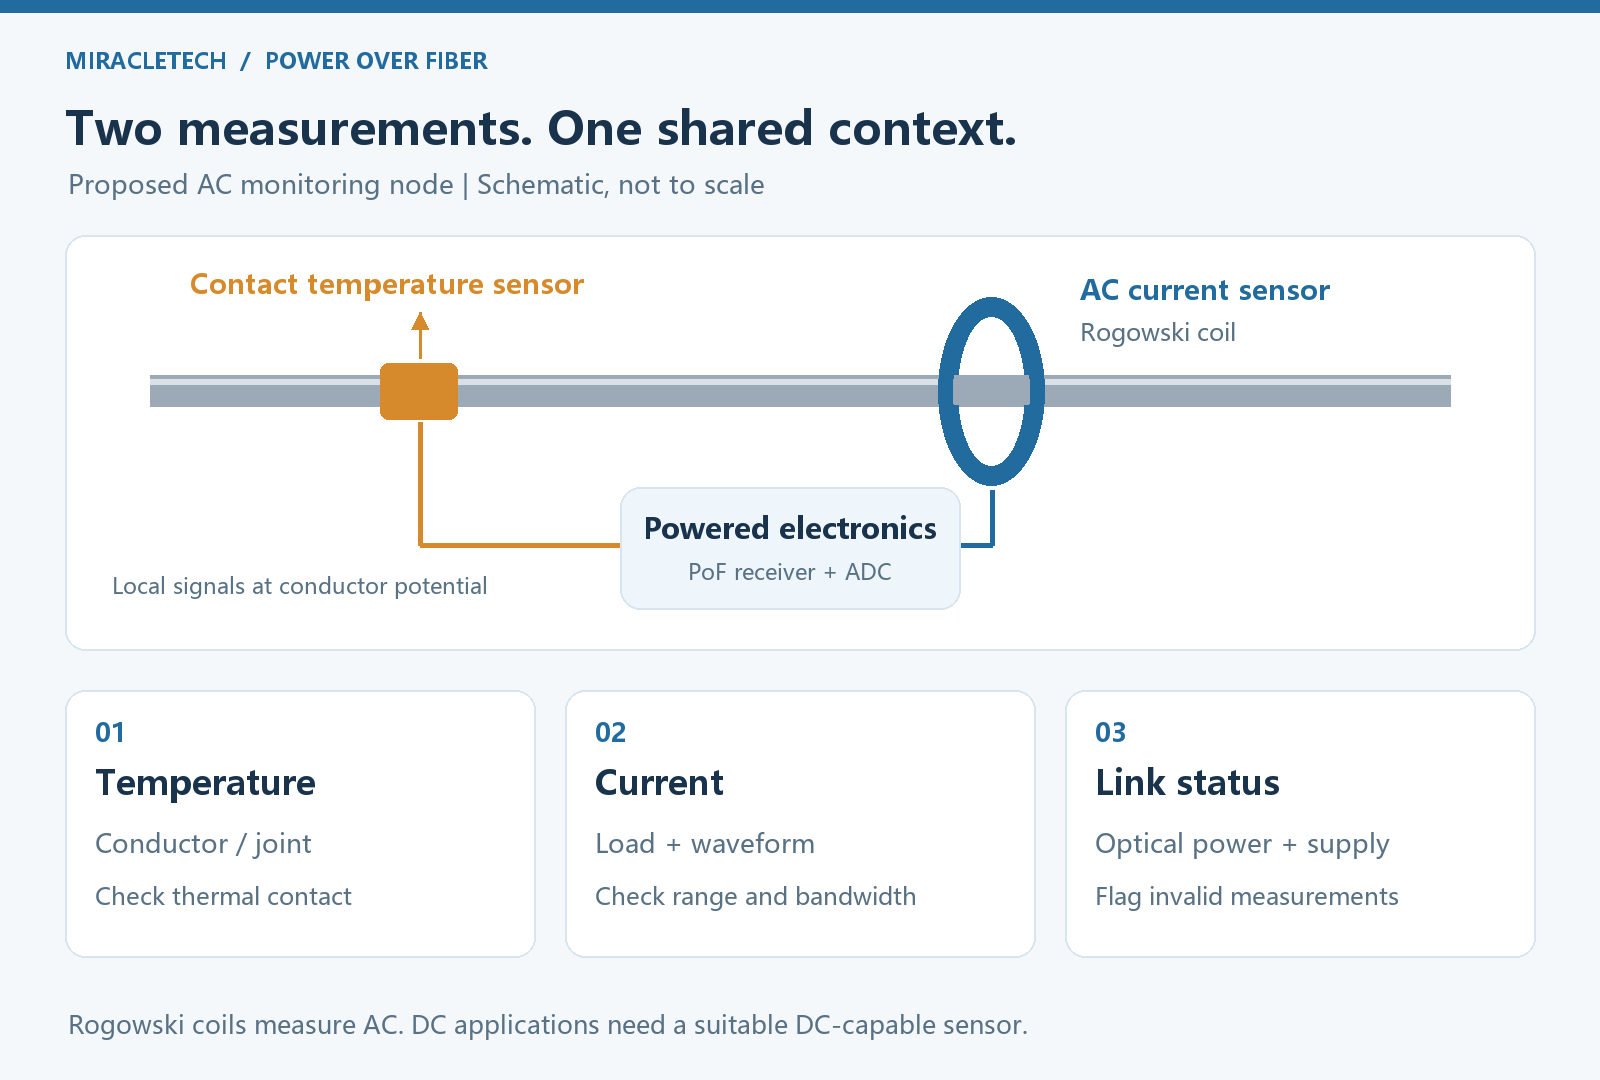
Node health. Record received optical power or an appropriate diagnostic indicator, regulated supply voltage, node temperature and communication status. Insufficient power or a timeout should flag invalid data or an equipment alarm. Loss of communication must not be interpreted as zero current or normal temperature.
Passive optical sensing is a separate approach: fiber Bragg grating sensors have been studied for temperature monitoring on high-voltage lines. Here, PoF supplies an active electronic sensing node; it should not be confused with directly measuring temperature through a passive optical response.
The power budget: start with the remote load
Begin with the actual consumption of the sensors, analog front end, processor and transmitter, including startup and transmission peaks. A first-pass budget can use the relationship below, followed by verification with the selected components:
Usable electrical power = launched optical power × optical-link efficiency × photovoltaic conversion efficiency × regulation efficiency.
Include fiber length, bends, splices and connectors in the loss budget. Conversion efficiency must correspond to the operating wavelength, temperature and electrical load. Published kilometer-scale PoF experiments show why distance and delivered electrical output must be discussed with the specific fiber, source and converter. A converter's peak efficiency is not the efficiency of the complete system.
With the optical source and link operating, node power can be independent of conductor load current, which is useful at low load. Monitoring during a line outage still depends on the ground-side supply, fiber availability and any remote energy storage. Continued operation after a fiber break cannot be assumed.
Using the data: from trends to actionable checks
- Compare load and heating: align RMS current, measurement-point temperature and environmental records on a common time axis to examine thermal response.
- Screen for local anomalies: compare nearby points or historical baselines under comparable load and weather conditions. Persistent rises, abrupt changes and differences between points should trigger investigation.
- Separate alarm types: distinguish temperature limits, measurement faults, insufficient power and communication loss so equipment problems are not mistaken for line faults.
This design targets condition monitoring. Dynamic line-rating assessment also needs weather data, conductor parameters and a thermal model. Protection applications require separate validation of timing, synchronization, reliability and interfaces.
Implementation: validate against the actual installation
- Define the operating boundary: establish AC or DC operation, voltage class, conductor geometry, installation position, monitoring purpose and maintenance access.
- Verify the power link: test startup, regulation margin, fiber-loss alarms and recovery at the worst expected temperature and optical loss. Provide appropriate laser interlocks and connector protection.
- Calibrate the measurements: assess thermal-contact error, current magnitude and phase error, and sensitivity to environmental changes.
- Validate the complete assembly: have qualified teams assess insulation, environmental, mechanical and electromagnetic performance for the intended voltage class before a field trial.
The value of PoF in this application is an isolated power path for active monitoring at high potential. Selection should balance node consumption, routing, measurement requirements and maintainability, rather than comparing laser power or converter efficiency in isolation.